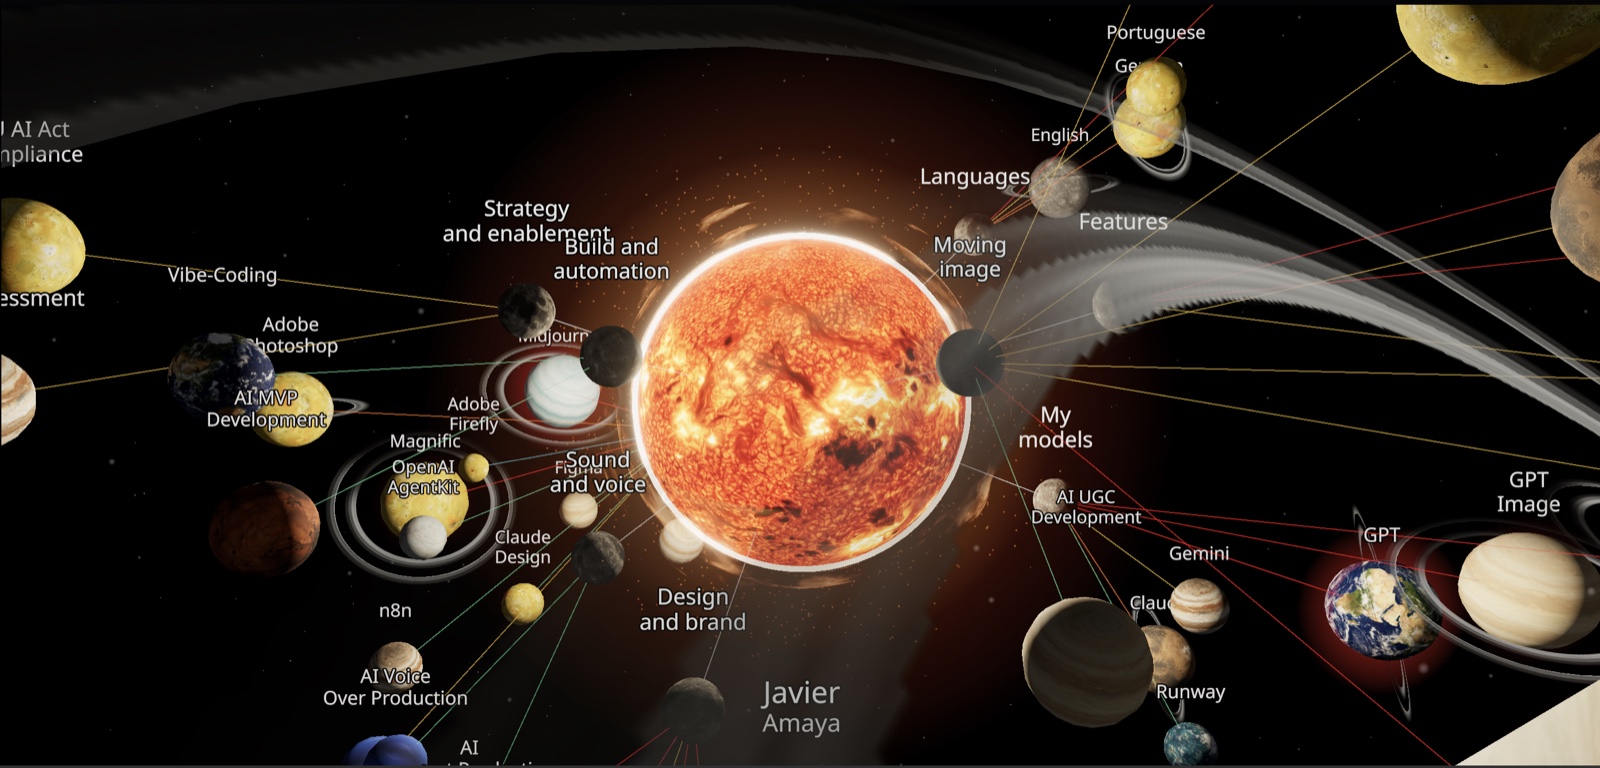
Fifteen professions, sixty-nine stages, and one map for what you can actually do.
The AI Graph is where a member builds a map of what they can actually do, stage by stage, the way a production actually runs. Open one of 15 professions, Filmmaking, Consulting, Games, Automation & AI Agents, and more, and the graph opens into that profession's own production stages, in order. 69 stages across the 15 professions hold 215 areas, and each area holds its skills first, then the tools used for them, then the deliverables they produce, from big to small.
Building one starts with Select: pick a profession, walk its stages, set a level as you go. Behind that simple path sits real depth. 244 skills, some carried over from the platform's own set, the rest researched fresh against ESCO, the EU's own skills classification, plus industry sources. 120 tools sit across 12 clusters, because a tool like Claude or Photoshop serves more than one craft. 52 AI models and 136 deliverables complete it, a moodboard deck, a script-and-treatment package, a final sound mix, each one traceable to a source. A visitor can walk the whole thing without an account. Registering is only needed to press Confirm and save it.
Every skill, tool and deliverable reads on the same five-word scale: Learning, Own projects, Paid work, Lead others, Teach it. That shared scale is what makes a graph comparable across a whole profession. A saved graph renders twice from the same data, a flat layered diagram and a 3D scene, and either one downloads as a JPG or a PNG, ready to attach to an application. Select is the way in that works today. Upload, Chat and Speak sit on the same page and say Coming soon, plainly.
The AI Graph and the AI Kompass are built to work together. The Graph maps what a person can do and at what level. The Kompass holds funding programmes with the fields that decide whether one fits: who can apply, the amount, the deadline. A mapped graph is what turns a funding search into a funding match. That matching is not built yet. It is where this goes next.
The short version
- —15 professions, each opening into its own production stages: 69 stages and 215 areas in total
- —244 skills, 120 tools across 12 clusters, 52 AI models, and 136 deliverables, every one sourced
- —One evidence scale for skills, tools and deliverables: Learning, Own projects, Paid work, Lead others, Teach it
- —Four ways in: Select, Upload, Chat, Speak. Only Select works today; the rest say Coming soon